There is an Object “Geo Map” in SAS Visual Analytics 8.4. Using Geo Map, the Bubble map, Co-ordinate map, Contour Map and Region Map can be created. But for Region Map the main requirement is Polygon Data.
What is Polygon Data?
The Polygon data is a set of several Latitude and Longitude and these Latitude and Longitude together create the boundary of a state. If one Latitude and longitude is available for a state then we can show Bubble map only not Region Map. The Polygon data can be downloaded from Website or purchased from ESRI. The Polygon data mainly contains five files:
Area.cpg
Area.dbf
Area.prj
Area.shp
Area.shx
Here “Area” is the name of file, it may be different for shape files but the extension of polygon data should be ‘cpg’, ‘dbf’, ‘prj’, ‘shp’ and ‘shx’. All these files are necessary for Region Map.
Ways to make SAS Dataset for Region Map:
There are two ways to make the data usable for Region Map:
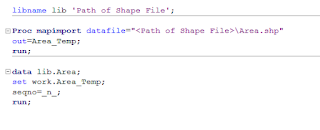
1. SAS Code for Polygon Data:
Figure 1: Code to convert shape file into SAS Dataset
2. Data available from SAS:
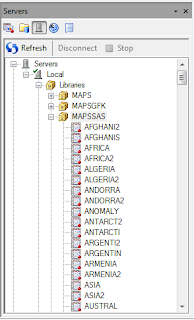
SAS also made available polygon dataset. There are three library present “MAPS”, “MAPSGFK” and “MAPSSAS” in SAS EG / SAS Studio. These library contain the dataset of all the countries at State level.
Figure 2: Polygon dataset in libraries in SAS EG
For each country, two tables are available. So we have to join the tables by ID column.
Import SAS Dataset in SAS Viya VA:
Steps:
Login the SAS Viya VA environment.
Click on “Data” option and go to import as mentioned in below image.
Import the polygon data as we prepared and after that click on “OK”.
Figure 3: Importing dataset in SAS Viya VA
Now, the data is imported in CAS and you can see the all variable available in data in SAS Viya VA.
Configure the Geography Item:
Steps:
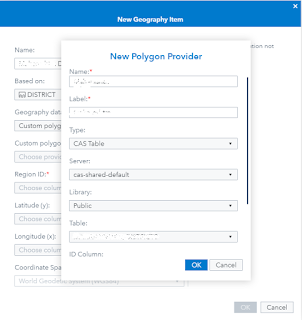
1. Click on the “+ New data item” in data pane. 2. Select the Geography Item. 3. Type the Name of new created geography variable and select the dataset in “Based on:” field. 4. Select “Custom polygon shapes” in drop down of Geography data type option. 5. Click on the “New” in Custom Polygon provider.
Figure 4: Creating New Custom Polygon Provider
6. Fill the information mentioned in below images:
Figure 5: Entering Information in Library and Table
Figure 6: Entering Information in ID Column
In Figure 6, the “ID Column” is DISTRICT but if any ID variable available in your data that represent the location, then you can also select that.
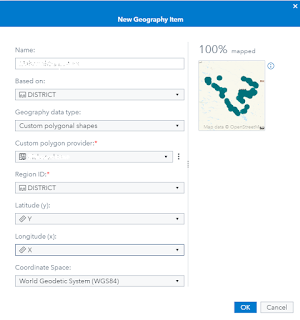
7. Next, after filling the below information, you can see that the data is 100% mapped.
Figure 7: Select Region ID and Latitude & Longitude
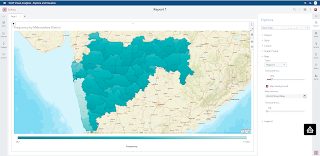
8. Now, drag and drop the new created geography variable (“Area” in my case). Go to the Options and select “Region Map” in “Map Type” and click on “Map Background” icon.
Figure 8: Final Region Map in SAS Viya VA
In Map Service option, you can change the background map. Here is the Region Map of District Level.
Thus, we can create the region map for the country, state, tehsil and city based on availability of polygon data.
Our infrastructure management approach is holistic, addressing capacity monitoring, data storage, network utilisation, asset lifecycles, software patching, wired and wireless networking and more.
James Weighell
November 26, 2021 - 2:21 pm
A hosted desktop solution allows for the delivery of a consistent and scalable IT experience for all users in an organisation. With this solution, users gain access via a desktop icon or link.


Comments (2)
Obila Doe
Our infrastructure management approach is holistic, addressing capacity monitoring, data storage, network utilisation, asset lifecycles, software patching, wired and wireless networking and more.
James Weighell
A hosted desktop solution allows for the delivery of a consistent and scalable IT experience for all users in an organisation. With this solution, users gain access via a desktop icon or link.